Data paralysis – From dashboard chaos to decisions that ship
Mar 11, 2026
One of my clients – a mid‑markets CMO and his marketing department – ran 12 dashboards. Some were barely touched. In steering meetings none of them guided choices. Directions were taken rather based on opinion, not backed with data and facts.
Until we switched to a 3‑months-rhythm that continuously turns data inspiration into action, by forcing some few next best steps every month.
Analysis paralysis isn’t mainly a tool or data problem; it’s a rhythm and decisions problem. I've seen too often, that overthinking delays action beyond useful timeframes. Or worse – available data not being used at all. This typically leads to budgets being thrown out of the window.
Unless a fast and lean operating rhythm converts data into inspiration, and turns insights into movement for steady and efficient business change.
How data fog and tool sprawl hinder decisions, progress and momentum
Mid‑sized organizations often drown in siloed dashboards:
- Web analytics, social networks, ads campaign data for marketing
- CRM for sales
- High-level financial KPI for the finance department
- Product tracking elsewhere
- And so on...
Thus no single view translates to the overall next best decision – at that moment it’s needed. When more reportings become a hindrance to shipping, you indeed may have beautifully inscened numbers. But:
What's missing, is a rhythm turning data into action:
A rhythm that simplifies insights.
A rhythm that turns insights into hypotheses.
A rhythm that turns experiments into realised outcomes.
A rhythm that produces business relevant outcomes within short periods of time.
The five faces of data paralysis – and how to overcome them
According to my observations of hundreds of mid-sized projects within the past 10-15 years – and this hasn't really changed over the years – there are five core problems, why data is underused and not turned into business value (you can download the infographic as PDF here):
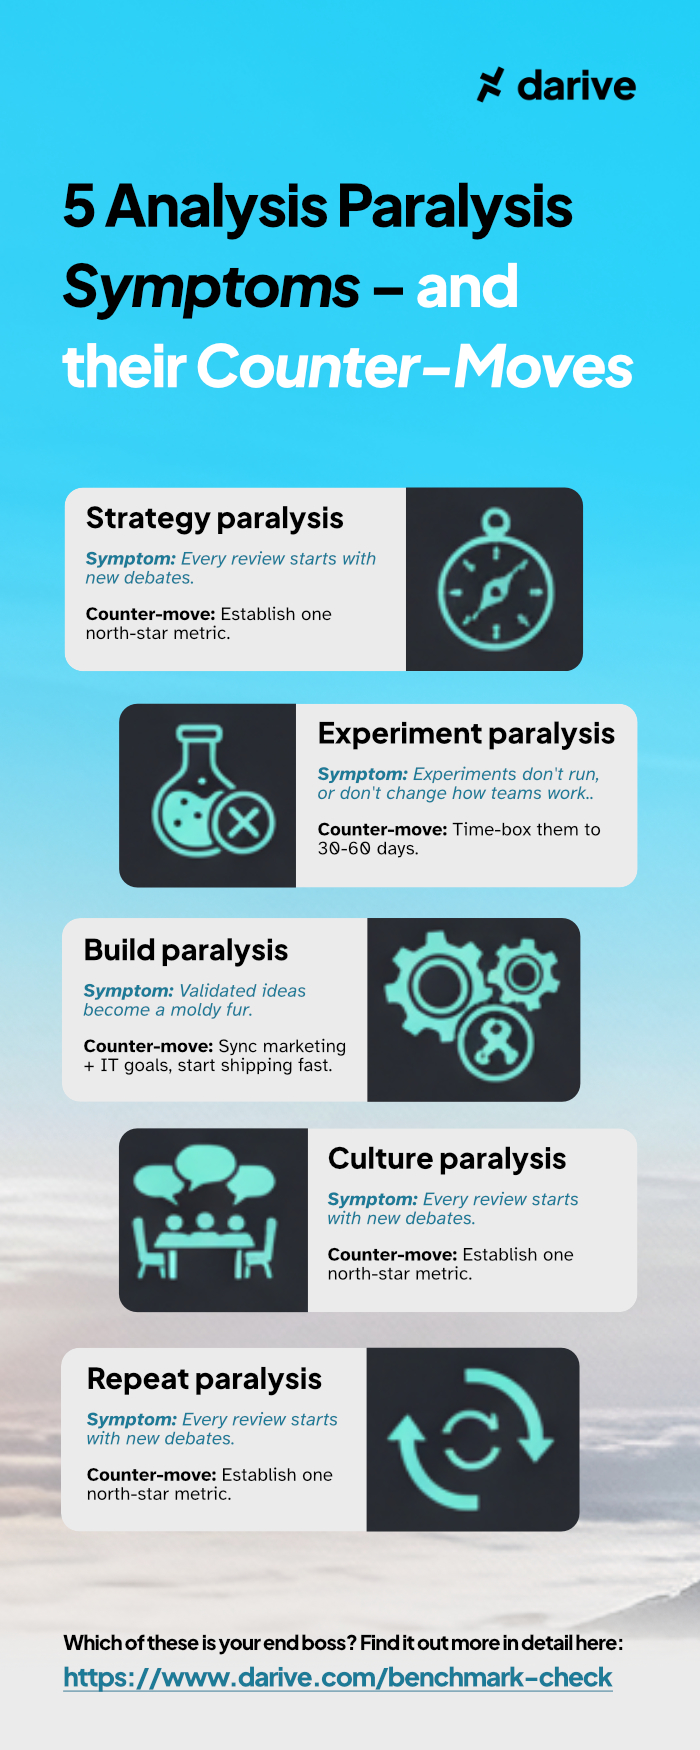
1. Strategic paralysis: When metrics become battlegrounds
The symptom: KPIs drift by committee and every review restarts the debate instead of focusing execution on one quarterly “win”.
The counter‑move: Choose one KPI or "north-star metric" for the next few weeks or months to win. Ask the right questions. Add two or three more guardrail metrics. And establish a pre/post analysis and ongoing optimisation iterations ritual.
2. Experiment paralysis: The experiments graveyard
The symptom: The good thing is, experiments are running alredy. But the downide is, they don’t really change how your team works. Hypotheses are too weak, they're just scratching on the surface. Also, analyzed learning effects remain to be rather superficial, and thus they get trapped in slides (here's how to do an analysis that really inspires). The CFO and CEO? They aren't celebrating such results.
The counter‑move: Raise hypothesis quality, instrument it cleanly, time‑box the cadence to 30–90 days, and focusing more on speed than on perfection to gain momentum and compound learning effects.
3. Building paralysis: Implementation bottlenecks
The symptom: Validated ideas wait months while momentum dies in IT and agency backlogs. They churn without clear strategic urgency and without ownership.
The counter‑move: Sync together goals for marketing and IT. Are they both part of the same team? Often, as it turns out in many companies realities, they're not. Change that! And then, convert won and validated experiment results into playbooks with an owner, a running SLA budget, and tracking keys to ship the smallest version as soon as possible, in order to leverage its business values as early as possible.
4. Culture paralysis: Death by committee.
The symptom: Not only between marketing and IT, but also inside the marketing team itself, consensus is missing, responsibility diffuses, and meetings multiply without decisions or visible and time-frame bound ship‑lists. These all limit your ability to make informed decisions and progress.
The counter‑move: Lightweight rituals – monthly decisions, experiments and progress status reviews that increase engagement, quarterly retros with deep-dive inspiration analyses bringing up new data-backed inspiration – and a visible and re-prioritized ship‑list – to train your teams muscles for data literacy, learning, and action.
5. Rhythm paralysis: Starting from zero every quarter
The symptom: No operating rhythm and overwhelm, knowledge fails to compound and progress resets on day one of each cycle.
The counter‑move: A renew‑and‑rise loop that starts with revisiting last quarter’s main learnings and shipped outcomes, raising the bar each time by one more turn, eliminating unnecessary and limiting procedures, and realigning KPIs to keep as focused as possible and reach your next level.
Mini case study: A 90‑days turnaround from data paralysis to action
Let's have another look into above mentioned mid-sized company with their 12 dashboards – and how they managed to turn that game.
The challenge: When data is available, but not being used efficiently.
My above mentioned client and his mid-sized company had many dashboards, but still...:
- No progress, in their most important goals.
- No actionable goals, which lead to regular KPI drifts.
- No operating loop, which lead to decisions mainly based on opinions, not facts.
A lot of gut feeling. Few data and facts being taken into account. Few data-informed or data-driven decisions. The result? Being stuck was more status quo than exception. Larger parts of budgets being burnt.
Until we launched a decision and production rhythm was launched in their team, which finally brought data-inspired direction and velocity.
The strategy: Start with single North Star KPI, gain momentum, and spread into the whole company.
We defined some core strategic pillars, enabling momentum and movement:
- Define a north star KPI: They committed to one KPI win for the next 3 months.
- Set up a prioritised ideas backlog: This helped them to identify highest likely winners as well as low effort quick win projects. The best ideas live at the intersection of both.
- Ship 2–3 of these goal-oriented changes as experiments: Bring the ideas live fast, and as simple as possible.
- Report validated results for each: Deliver the most relevant results and learnings into team and company as soon as possible.
The scaling effect? This way, data based inspiration spreads and multiplies. Thus, other teams are higher likely to also start acting upon these principles. The further goal is to transform more parts of the company, resulting in even higher momentum. It typically starts within marketing teams first, and then gains more common ground also in other teams.
The implementation: It's not about a single idea going live, but about a team being empowered to steadily deliver results.
- We made sure to have at least one monthly experiment status and decision review – so you can have innovative results being confirmed latest after 3 months.
- We implemented reliable tracking mechanisms – and update them regularly according to new North Star goals. Further we make sure that 2-3 guardrails work accurately.
- We started with regular data analysis – analyse as soon as possible, like 2-3 days after go-live. Look at the before/after results: Are the north star KPI and the 2-3 guardrails flowing in as expected? And after 3-4 weeks, re-analyse and re-evaluate these same measures again.
- We set up a single source of truth – share the results also with relevant stakeholders from other teams. This reduces debate friction and accelerates production speed.
And by the way: It's a very good thing when your team owns control and steers itself such an elementary rhythm, not outsourced to external experts or agencies. We made this a priority.
The result pattern: What we achieved
Faster analysis. Fewer restarts. More ideas being validated. More features going live. All backed by data and facts. A higher production velocity rate. A rising “backlog‑to-results” conversion rate now can leverage their compounding effect quarter over quarter, as the team starts each cycle smarter than the last before was finished.
Defeating data paralysis: The 90-days operating rhythm blueprint
Use this rhythm blueprint in order to gain more momentum and leverage the processes compounding and learning effects:
- 30 days: Define one KPI to win, baseline it, define best quick win ideas, and draft a hypothesis backlog scored by impact x confidence x effort for the next two months to set up a measurable rhythm.
- 60 days: Ship 2–3 smallest viable ideas as lean experiments with clean pre/post measurement (or even better with A/B-Testing if you've got enough data amounts/traffic available), document learnings, and start reporting validated changes into your teams to start inspiring colleagues.
- 90 days: Consolidate outcomes, begin with retiring lower‑value tasks, publish the updated and re-prioritised ship‑list, and raise the bar by one turn while reshaping the single KPI for the next quarter, in order to compound and gain more momentum.
Take it as a first starting point. Repeat the rhythm around every 3 months. At least for the beginning. Once established and proven, later, you can maybe even accelerate i.e. to every second month, or even every few weeks. Then – according to my experience – you should also individualise from standard blueprint to own deeper integrations – according to your individual orgs requirements – for then even higher efficiency uplifts.
While doing so, many are likely to realise one thing: Imperfect becomes the new perfect. Because when small ideas being validated fast turn questions into evidence, and constant improvements build up momentum on a reliable and leadership-supported tact, then things are really about to change. I've seen this several times, and teams always feel great when reaching these new grounds.
How to combine data, AI & creativity for excellent results: Gain even better hypotheses, faster analyses and stronger decisions
In times like these, it's useful and even needed, to keep AI in mind, in order to reach AI-enabled even higher velocity and strength.
- AI can accelerate analysis and visualisation, and even data strategy alignments and realignments. During the next weeks and months, I'll write more about such up-to-date methods, tips and hacks how to use AI in order to get maximum out of your data treasures. Recommendation for this - of course - is that you sign up to the darive Inspiration Pulse aka the Waitlist – see subscription box below.
- Seasoned human experience and creativity improves pattern recognition and hypothesis quality.
Creativity indeed is a game-changing power in terms of leveraging data signals. - But: Only a robust production rhythm transforms both – AI and human creativity – into steadily shipped outcomes and more momentum.
tl;dr – How to overcome data overload and analysis paralysis
This all is, what finally leads to steady uplifts and – in the end – to an excellent customer experience. You deliver and offer more clarity and better quality to your customers. You raise your own goal achievements, like customer satisfaction, revenue, more efficient expenses, or whatever your orgs goals are.
Speed and continuity compound advantage. And this way, it turns out, imperfect is the new perfect, when testing turns questions into evidence on a fast, reliable tact, speeding up your decision-making process and gaining momentum from within.
The above mentioned counter‑moves were forged from installing data-inspired empowerment tracks in several mid‑sized organizations. The extracted knowhow will soon be condensed and made available – for teams who want to own their production rhythm and speed up their innovation pace.
If you want to go even deeper now, you can read on in this blog about why darive exists and how darive applies above mentioned principles on its own brand launch.